
Points That Fade: Adaptive Gamification in a Two-Hour Citizen Science Mission in Santiago
On the afternoon of 11 June 2025, 69 students from Universidad Alberto Hurtado were signed up for a course activity that took them out of the classroom and into Barrio Brasil, in central Santiago, with a mission on their phones: find and report illegal dumping. The map was cut into 21 polygons of a few city blocks each. The unusual part was a small widget showing how many points a report was worth at the exact spot where they stood. That number was not fixed. It dropped around places that had just been reported and climbed back slowly as the minutes passed.
The paper about that afternoon is now out, open access, in the International Journal of Human-Computer Studies. This post is the short version, the parts I would tell a colleague first. The methods and the statistics are in the paper.
Where, Not How Much
In location-based citizen science the dataset is only as useful as its coverage. If every volunteer photographs the same busy corner, the campaign ends up with ten pictures of one problem and nothing about the block behind it. Most gamification does not help here. Points, badges and leaderboards reward volume, and a fixed reward per report pays the same for the tenth photo of that corner as for the first photo of a street nobody has walked.
We wanted an incentive that cares about where a report lands, without telling anyone where to go. The idea has a precedent. PhotoCity, a game for collecting photographs to build 3D models of buildings, paid players more for pictures that extended a model into views nobody had captured yet. We borrowed that logic for a task where, unlike a 3D model, nobody knows in advance where the gaps are.
The Rule
Every valid report earns between 0 and 100 points. A fresh report lowers the value of the ground around it: right next to it the cut is the full 100 points, 50 metres away it is a quarter of that, and at 100 metres it is gone. The cut also wears off with time. It shrinks steadily over the first 48 minutes and then stops at a small leftover, a fifth of its original strength, so a spot right beside an earlier report can climb back to 80 points during the session, but not to 100. If several earlier reports are in range, only the strongest one counts; they do not stack. Only reports inside the same mission area are considered.
Take two neighbouring areas, A and B, both at full value. Someone reports in A. The points around that spot drop, and a participant standing nearby now sees more points on offer towards B. If B fills up with reports while A stays quiet, A mostly recovers over the next 48 minutes and becomes the better target again. Nothing is blocked. Anyone can still report next to an earlier report; they simply get the reduced value, and the app tells them so before they do it.
That last part matters to me. A floating widget shows the points on offer wherever the participant is standing, the task screen keeps the preview alive while the photo uploads, and a confirmation screen shows the points actually earned. The preview is computed on the phone so it feels instant; the real score is computed on the server against the current record of prior reports.
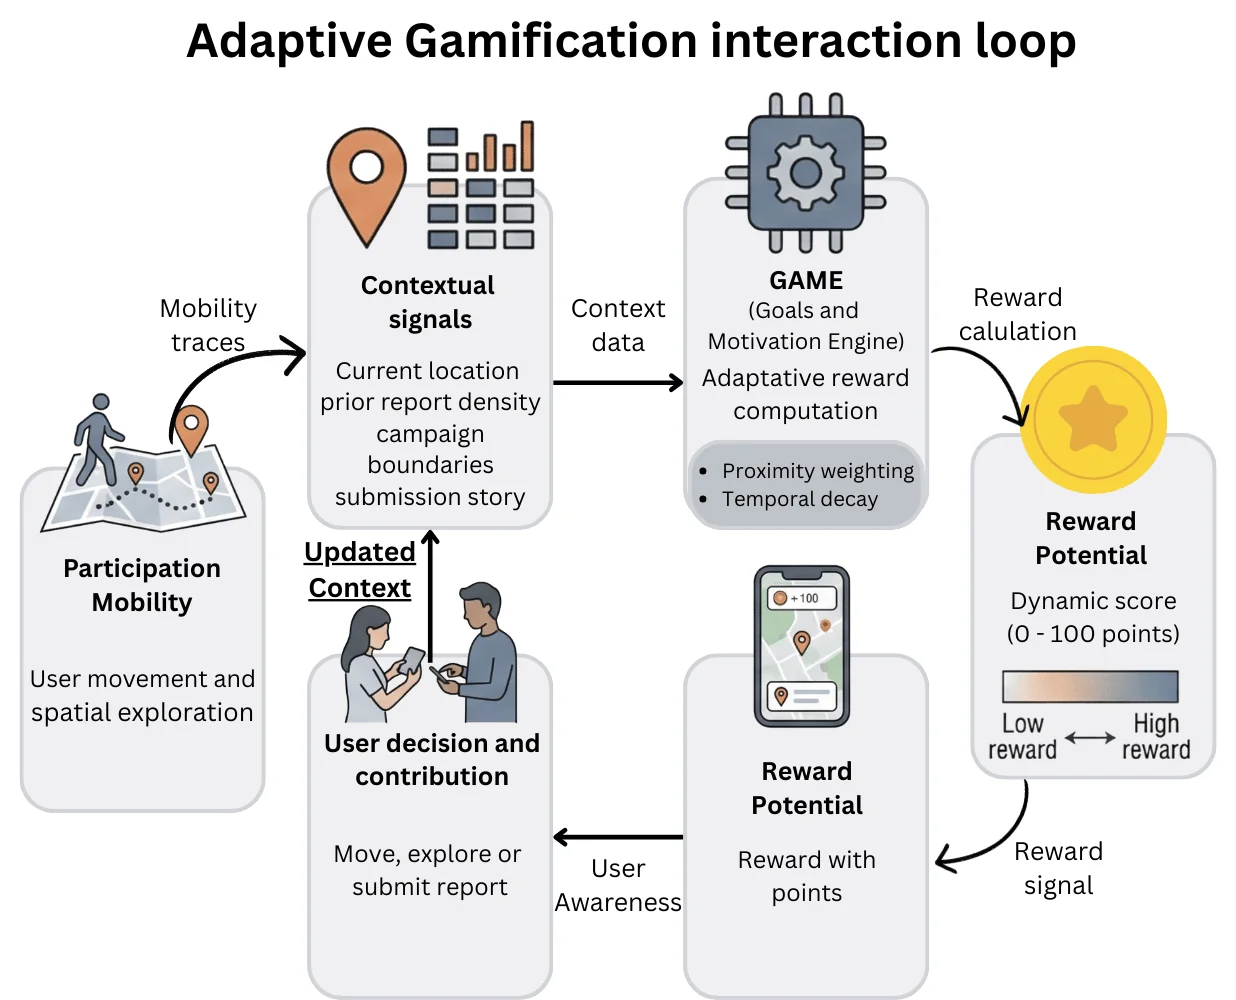 The loop the engine implements. Movement produces context, context produces a reward potential, the reward is shown before the participant acts, and the action updates the context for everyone else.
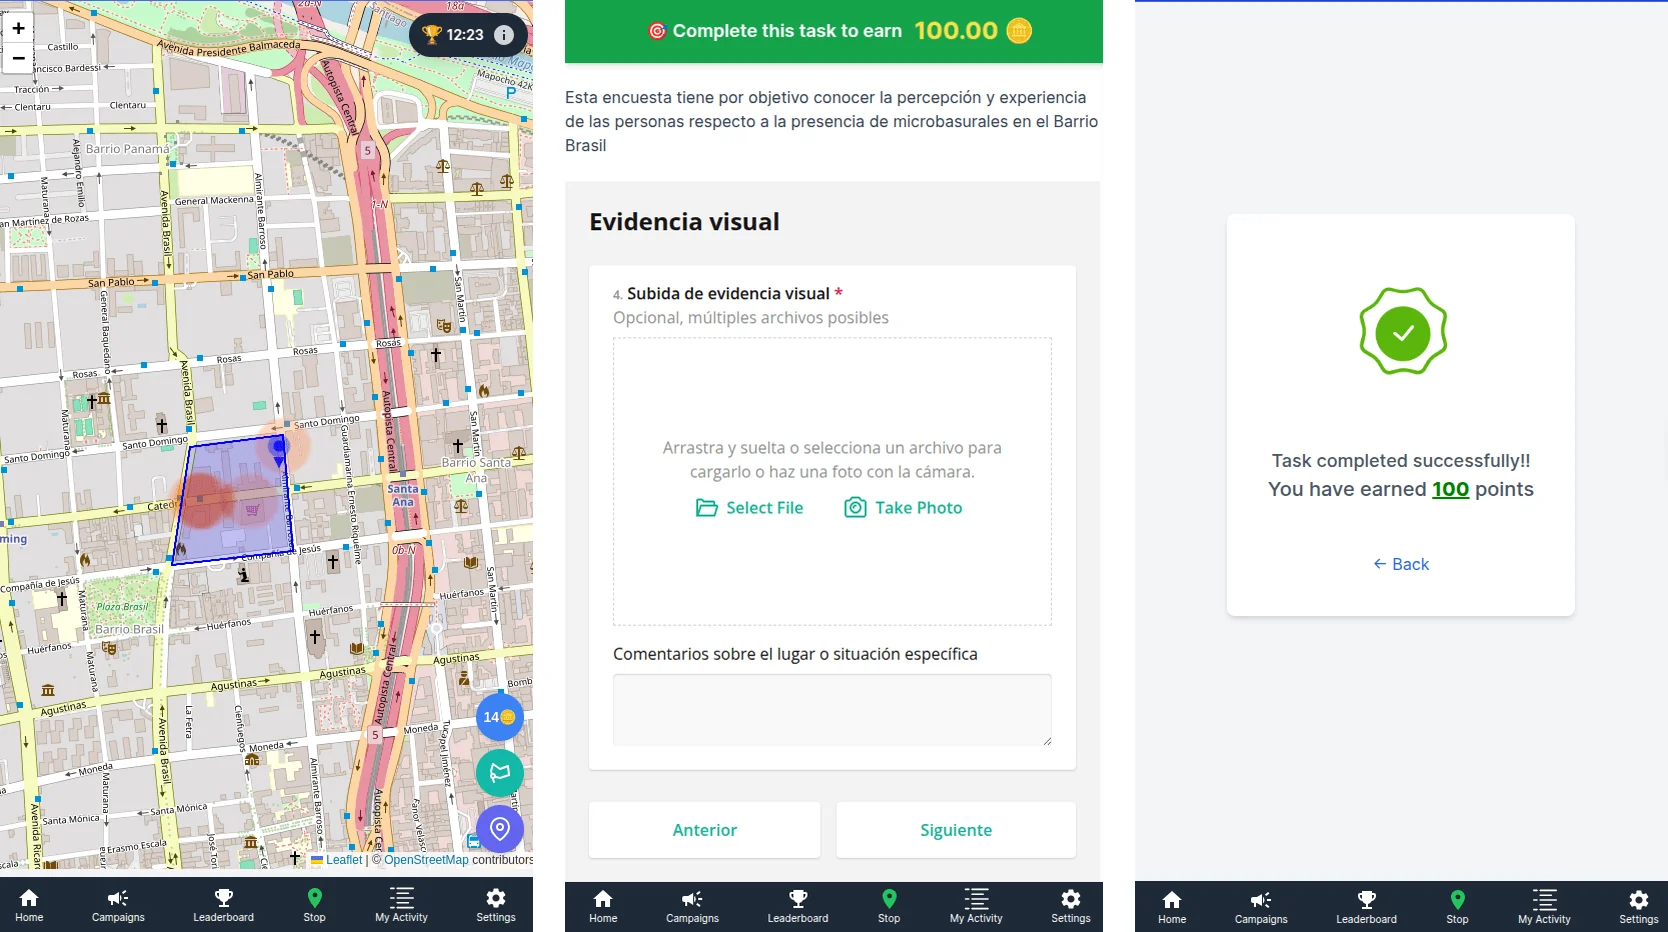 What participants saw: the reward preview on the map (left), the live value while uploading evidence (centre) and the points earned after submitting (right).
I implemented this as a strategy inside GAME, the open-source gamification engine I wrote about earlier, and the GREENCROWD app did the rest. The 100-metre radius, the 60-minute decay window and the one-fifth floor were my choices for this neighbourhood (the floor is why the recovery stops at 48 minutes rather than 60). A campaign over a larger or sparser area would need different values, and the paper says so.
Two Hours in Barrio Brasil
The session ran from four to six in the afternoon as part of a scheduled course activity. Participants used their own phones, picked one polygon to explore and moved freely inside it. A report meant a short survey, photo evidence and a comment, submitted at the GPS position where they stood. Accounts were pseudonymous; we never stored names or email addresses. There were no prizes beyond the points, and we left streaks and time bonuses out on purpose, so the only adaptive thing running was the rule above.
One practical detail changes how the numbers should be read. For safety, the instructor recommended moving in small groups. Several people could look at a dumping site together and decide to report it while one phone did the submitting. So when I say that 11 people reported, I mean that 11 accounts logged a report. The number of people who took part is higher, and unknown, because we did not record group size.
With that in mind, here is the funnel. Of the 69 students enrolled, 64 reached the campaign screen, 34 joined the mission, 26 opened the reporting task and 11 submitted at least one geolocated report, 27 reports in all. Movement traces were recorded for 36 people, and 27 answered the gameful experience questionnaire (GAMEFULQUEST) afterwards. Three of the 11 contributors produced about half of the reports.
If an active rate of roughly 15 per cent sounds low, it is also familiar. Our earlier campus experiment landed at almost the same figure, and games with a purpose such as PhotoCity reported the same skewed pattern at a larger scale: a small minority produces most of the usable data.
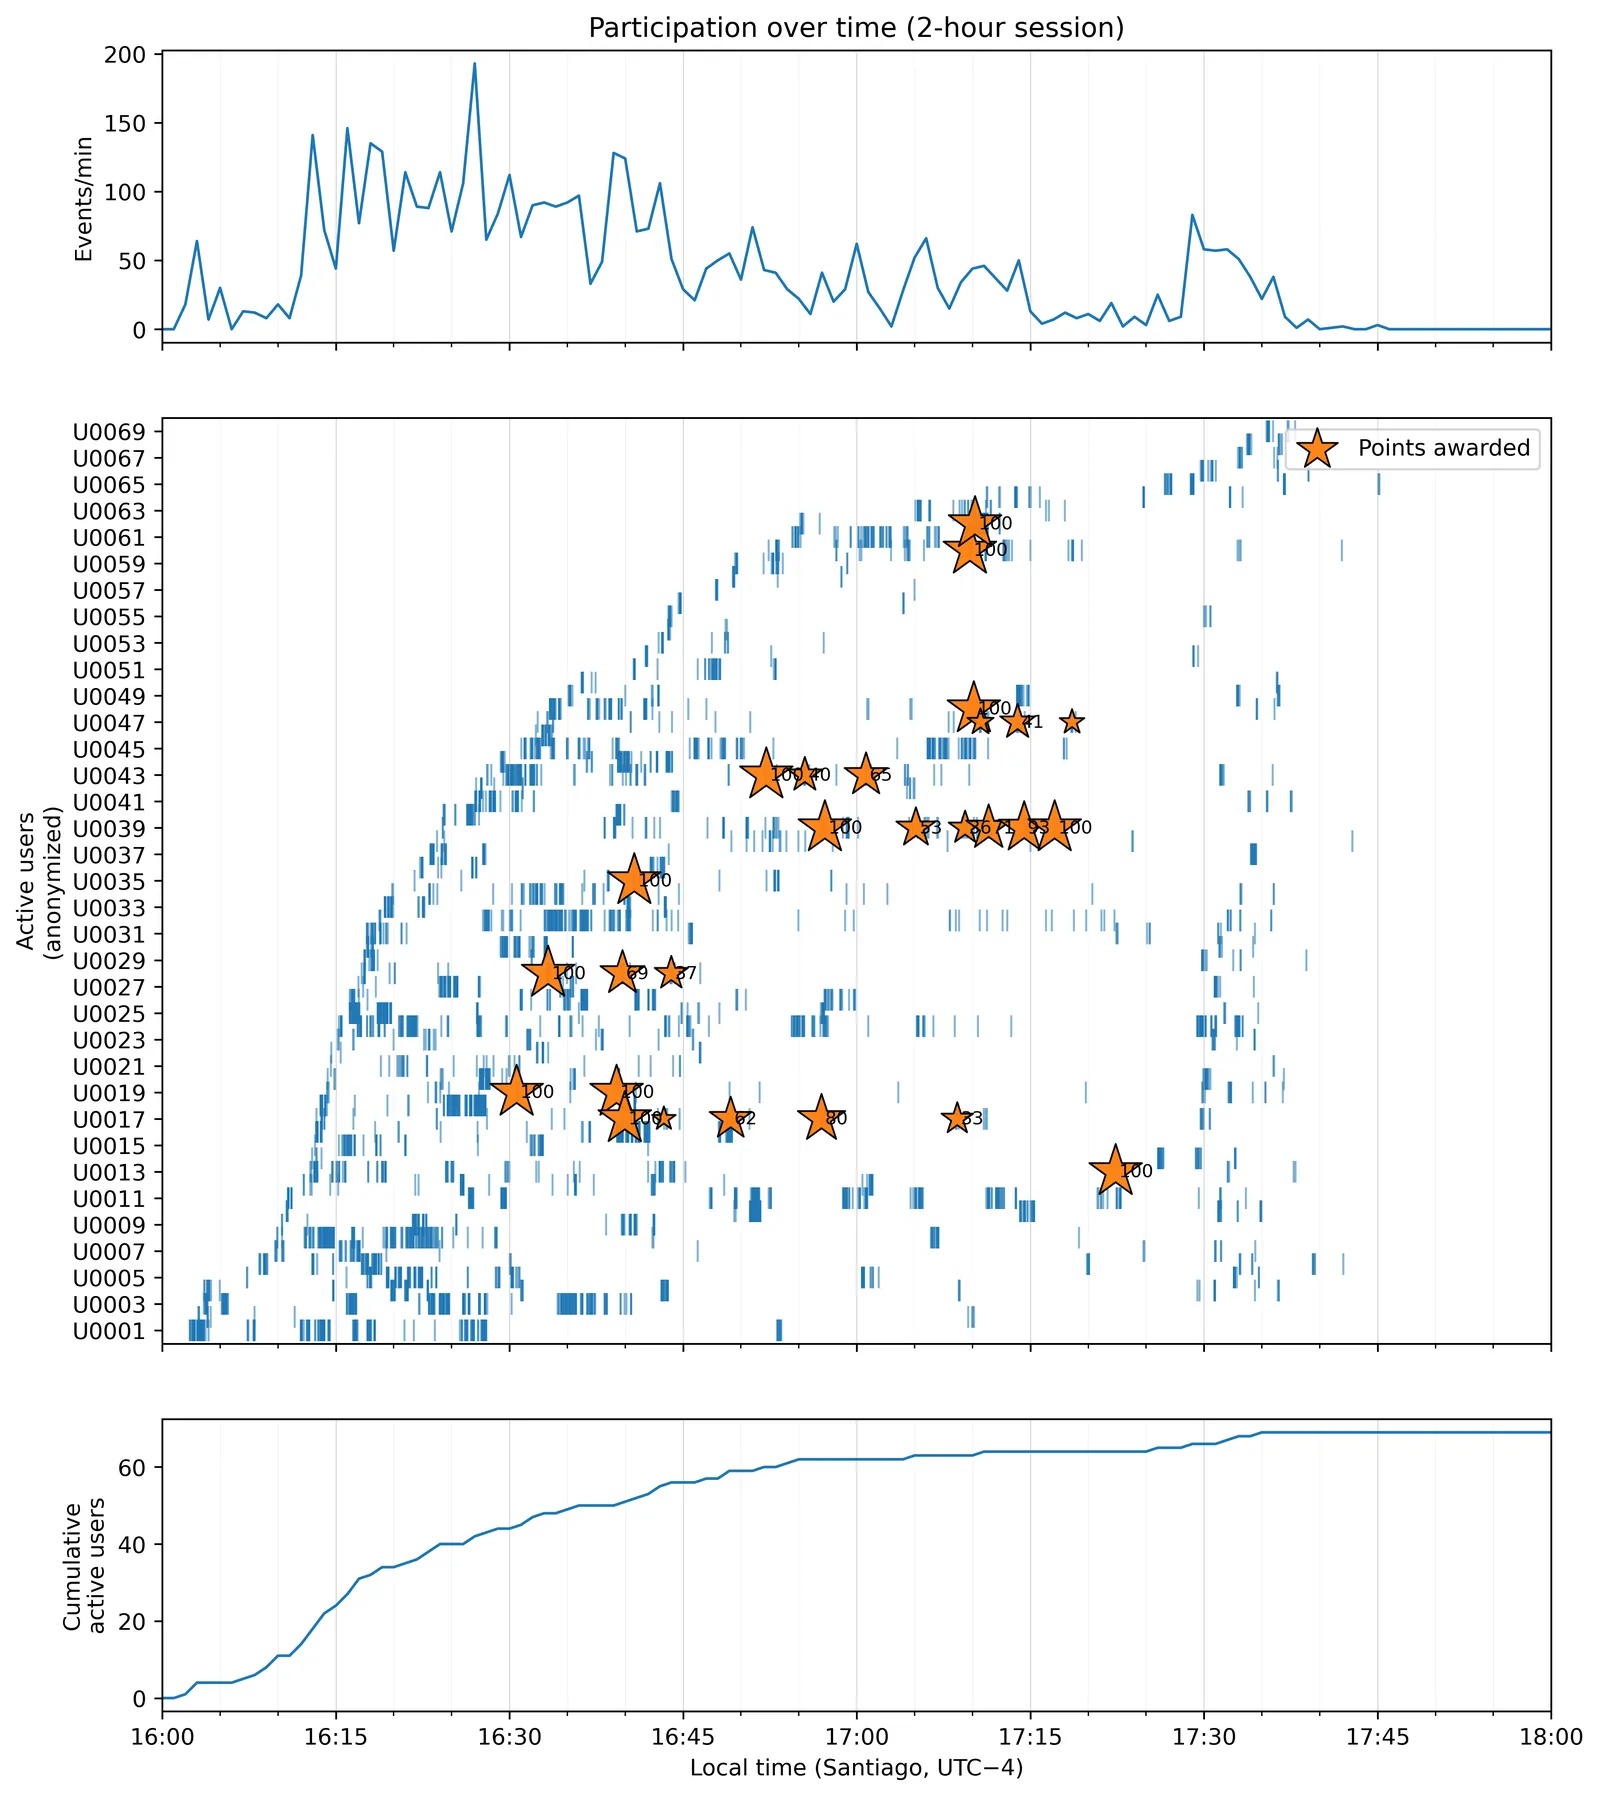 The session minute by minute. Stars mark the 27 point awards, sized by value. All of them fall between minutes 31 and 82; the rest is most likely people getting to the polygons and coming back.
What We Saw
Walking Somewhere Is Not the Same as Reporting There
Movement traces covered all 21 polygons. The 27 reports landed in only 8 of them. Some of the most walked polygons produced no report at all, and a couple of lightly visited ones produced more reports than their foot traffic would suggest. The correlation between how many logged GPS positions fell in a polygon and how many reports it got was moderate (a Spearman rho of 0.44), so foot traffic explains only part of where reports landed.
Concentration indices make the same point in one line: across the 21 polygons the Gini coefficient was 0.43 for movement and 0.73 for contributions. Presence was spread out; reporting was concentrated.
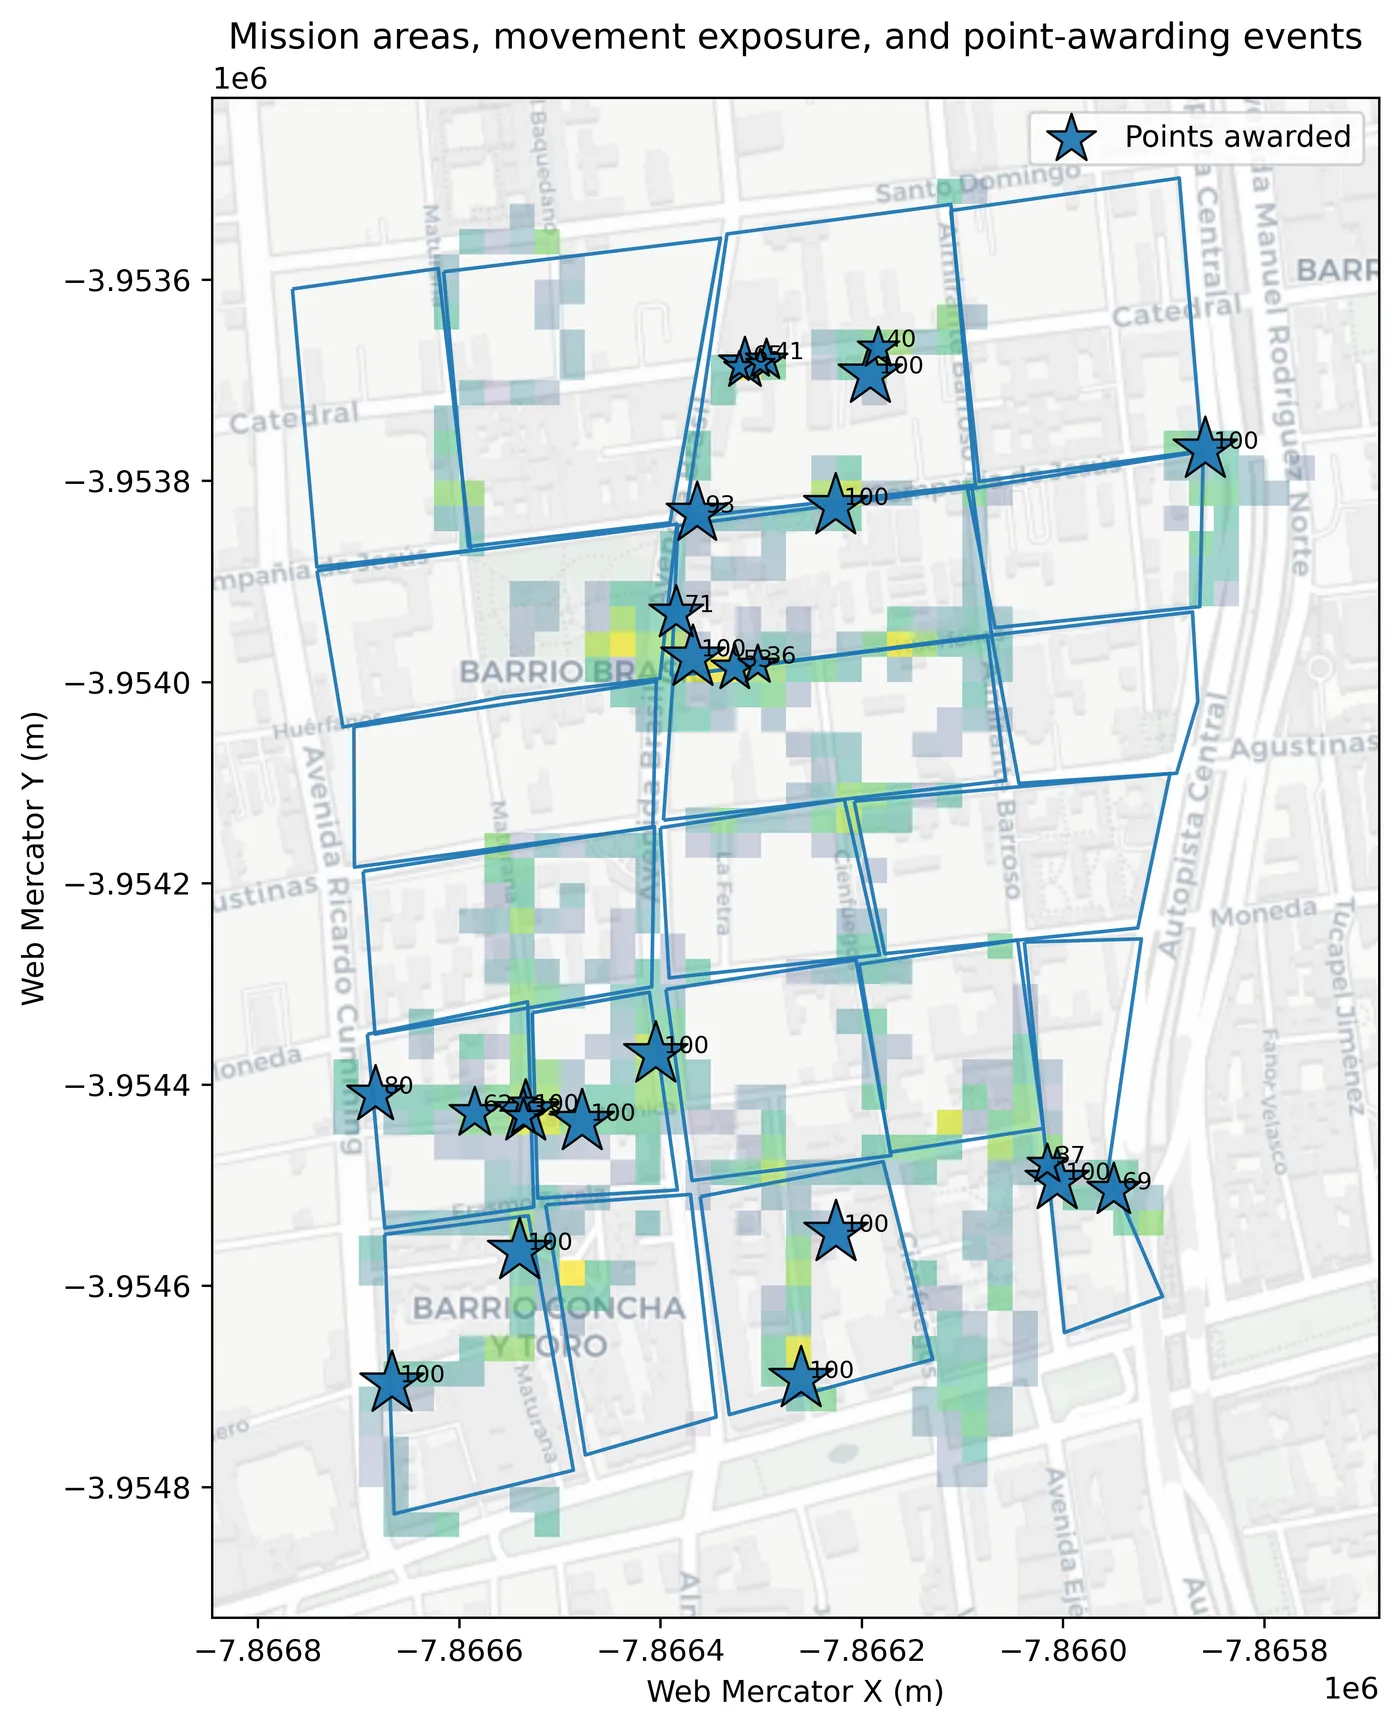 Where people spent time (grid cells, brighter means more) and where points were awarded (stars, with the value).
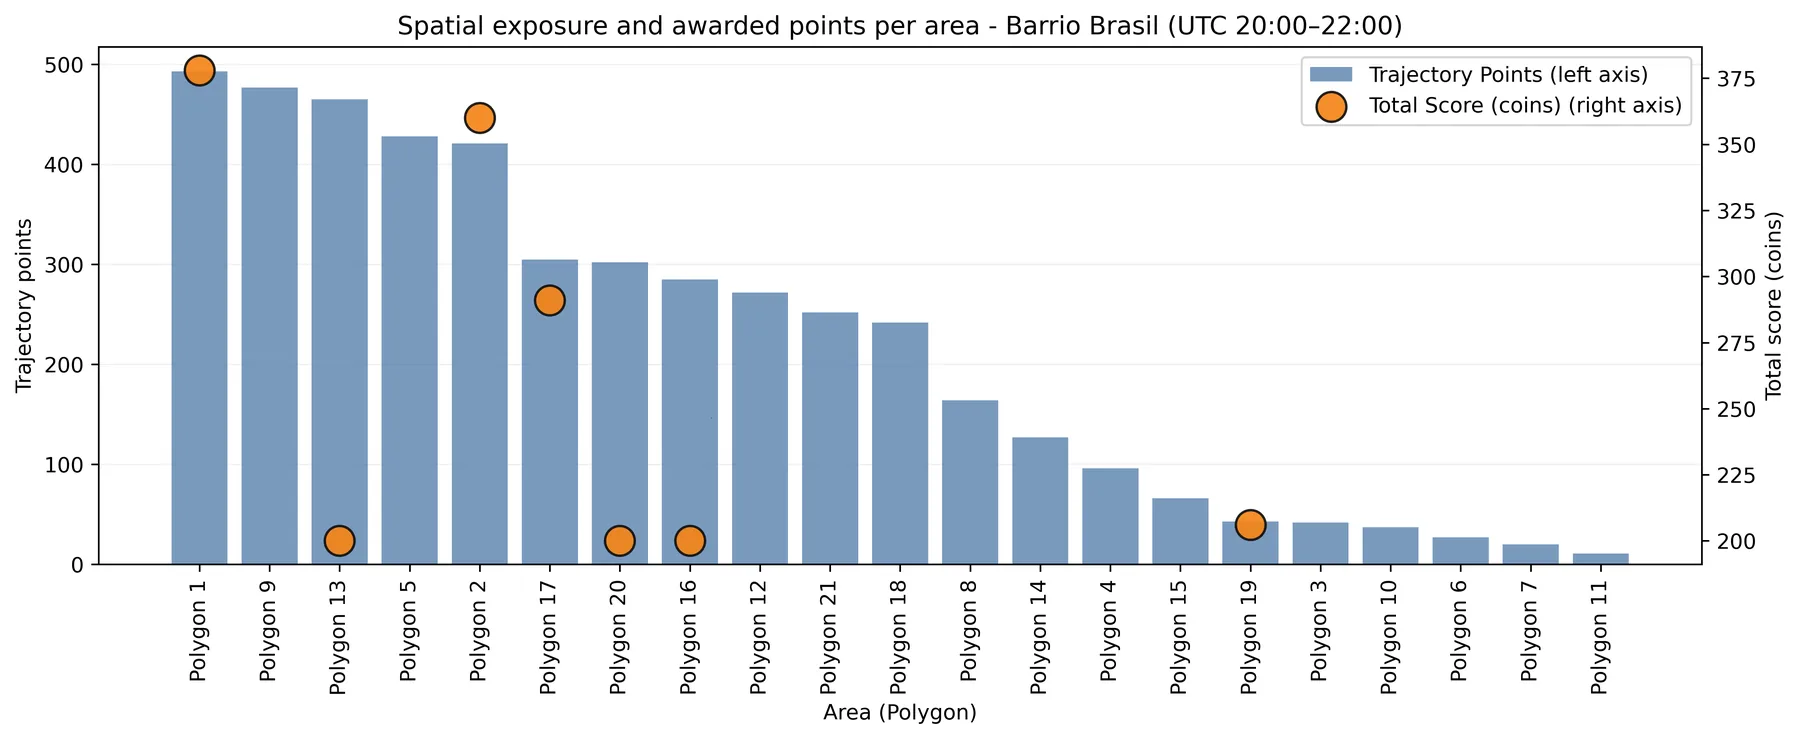 Trajectory points (logged GPS positions) per polygon (bars) and total points awarded there (circles). Several of the busiest polygons have no circle at all. Only seven circles are visible: the eighth polygon with reports had a single award, below the range of the right-hand axis.
The Reward Map Did Not Simply Copy the Movement Map
This is the result the paper is built around. We cut the neighbourhood into 100-metre cells and asked, for each cell, whether it held significantly more of something than its surroundings (a Getis-Ord hotspot). We did this twice: once for time spent, once for reward value, which is also, unavoidably, where there was dumping to report (more on that below). The mobility hotspots sit along one central corridor, the streets people drift along anyway. The reward hotspots reach into cells towards the edges that were visited less. The two maps overlap only partly, roughly a quarter to a third depending on how you count, and they disagree most about their peaks: the three busiest polygons on each map share just one. In about six of the 21 polygons more ground counted as hot for reward than for movement, and several of those had no movement hotspot at all.
I want to be careful here. The divergence is partial. The two maps still correlate at about 0.58, and a paired test on cell scores did not reach significance. The street grid shapes both maps, and the reward map departs from it in localised pockets rather than redrawing the picture.
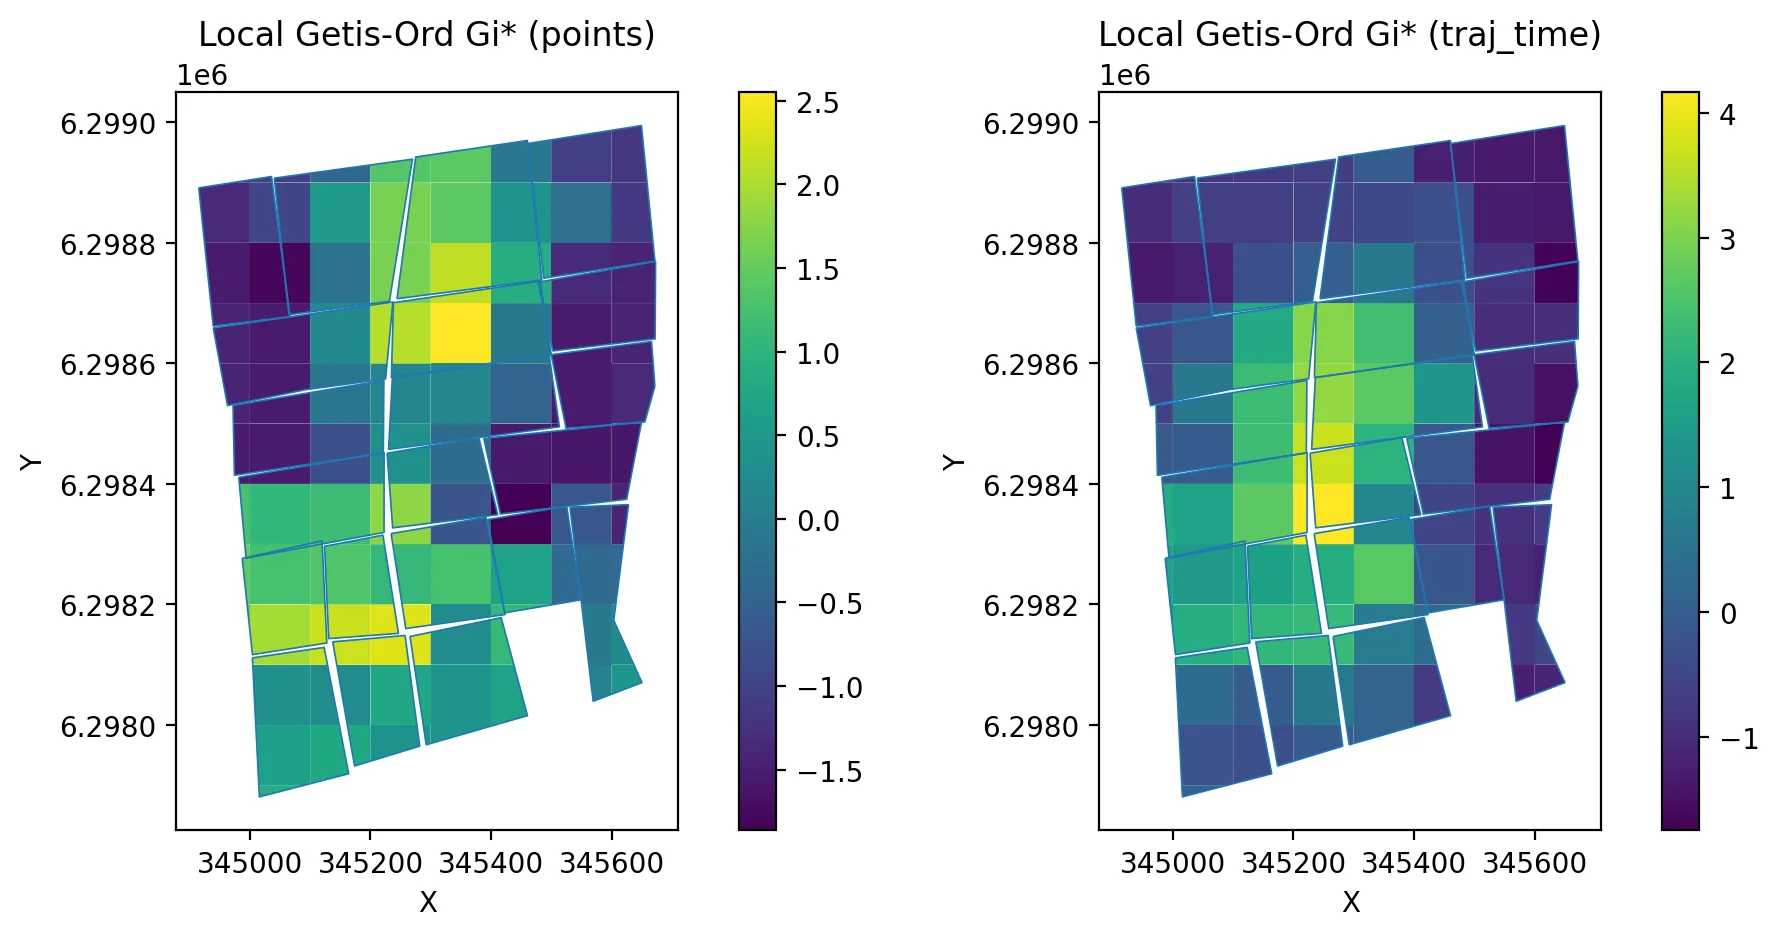 Hotspots of awarded points (left) and of time spent (right). Both follow the street grid; the brightest cells are in different places. Overlap (Jaccard) 0.28 by grid cell and 0.38 by polygon; the top-3 polygons of each map overlap at 0.20.
The Engine Did What the Paper Says It Does
Because the released data include the position and time of every report, we re-implemented the rule from the public dataset and evaluated it at the recorded position and time of each one. Fourteen of the 27 awards matched within two points and 23 within 10. Eleven of the 12 reports with no earlier report within 100 metres got exactly 100. The gaps are small and mostly in one direction, which is what you would expect if the offer was fixed where the task was opened and people then walked a few metres before pressing submit, although the data cannot confirm that is the reason. The one larger gap, a 65-point award, had its nearest earlier report 104 metres away at submission time, four metres outside the radius.
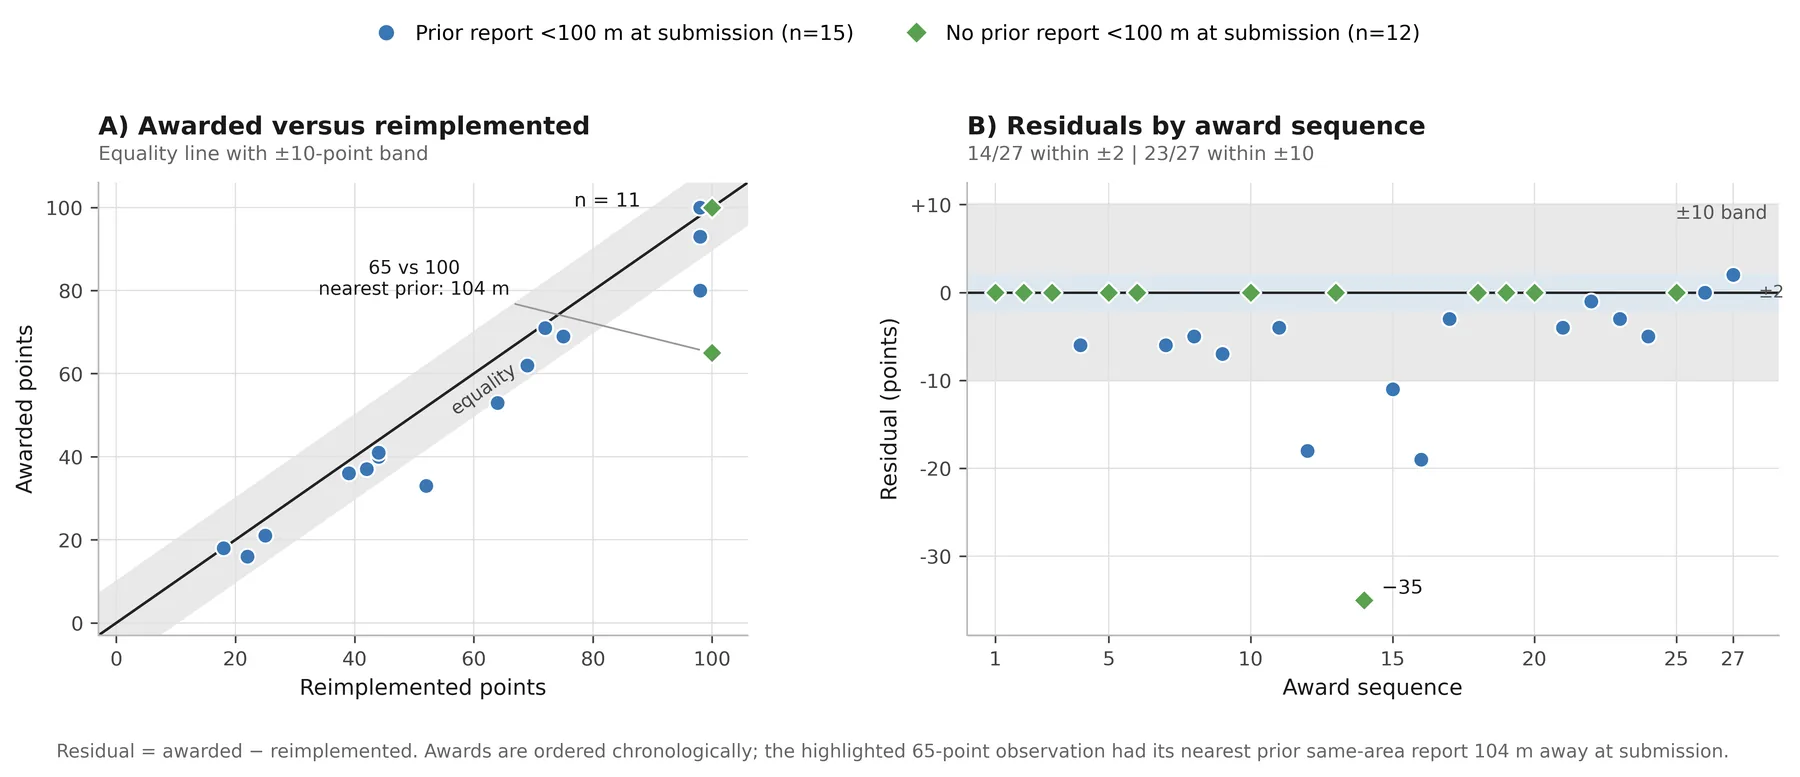 Awarded points against the same rule recomputed from the released data. Anyone can run this check from the Zenodo files.
A Good Experience Did Not Mean Efficient Reporting
GAMEFULQUEST scores were fairly high, a mean of 5.5 on a 7-point scale across the 21 screened responses, and every one of its seven dimensions went up with how much a person moved. None of them went up with how efficiently movement turned into reports; on the seven people with both kinds of data, every estimate pointed the other way. These are tiny, exploratory samples and the paper treats them as direction only. Still, it is a useful warning: a happy questionnaire tells you people were active. Whether their walking turned into reports is a separate question.
What This Does Not Show
Everyone saw the same rule, so there is no control condition. We cannot say the adaptive scoring produced a more balanced result than fixed points or no points would have. Nor can we say that anyone walked somewhere, or reported somewhere, because of the number on the widget. The maps describe where reward value landed, not why. Eleven contributors in one two-hour session, all students in a course activity rather than volunteers who chose to join, give design signals, not effect sizes. And points could only be earned where dumping actually existed, which we did not measure independently, so a map of where the points went is also, in part, a map of where the dumping was. We could rule out polygon size as the explanation for the concentration, but a quiet polygon may simply have had nothing to report. We also never asked participants whether they noticed why the number on the widget kept changing.
What the study does support is narrower and, I think, still worth having: under this rule, in this neighbourhood, the points did not simply follow the crowd. Some reward value went to streets people walked less, by a modest but measurable amount, and nobody was ever told where to go.
If You Are Building Something Like This
The paper distils six design implications. These are the ones I would repeat to anyone building a similar system.
- Use adaptive rewards to guide attention. A high reward in a sparse area is no proof that contribution is needed there; the area may be under-served or just empty.
- Evaluate spatial incentives with an independent measure of what was there to report.
- Report coverage indices (Gini, Hoover, entropy, share of occupied units) next to engagement counts. Our counts looked healthy and hid the concentration completely.
- Say how you drew the spatial units and test whether your results survive a different grid.
- Read surveys together with behavioural logs. Ours overlapped for seven people.
- Explain the rule to participants and check that they understood it.
What Comes Next
The obvious next study is a randomised comparison: this rule against fixed scoring, against no incentive, and against versions with faster or slower decay, with more contributors and with an independent record of where the dumping is. Longer deployments and a direct check of whether participants understand the rule belong in the same study. If I ran the session again tomorrow, I would also record group size and who held the phone.
A post-hoc check in the paper already shows how sensitive the suppression is to the decay window: with a 15-minute window instead of 60, a reported spot would have regained about half of its lost value by the time someone came back to it, instead of about a sixth. Whether that is better is a judgement call I made once and would now rather measure.
Everything is open: the paper (CC BY), the data and the analysis notebook on Zenodo, and GAME on GitHub. If you run a location-based citizen science campaign and want to try a coverage-aware reward, or want to be the comparison condition we are missing, write to me. We cannot run that comparison alone.
This post summarises findings from: Vergara-Borge, F., Emaldi, M., Olivares-Rodríguez, C., Gómez-Carmona, O., & López-de-Ipiña, D. (2026). Adaptive gamification as a spatial interaction mechanism in citizen science. International Journal of Human-Computer Studies, 219, 103957. https://doi.org/10.1016/j.ijhcs.2026.103957. Figures reproduced from the article under the CC BY 4.0 licence.